Operations and quality data that isn't weeks out of date
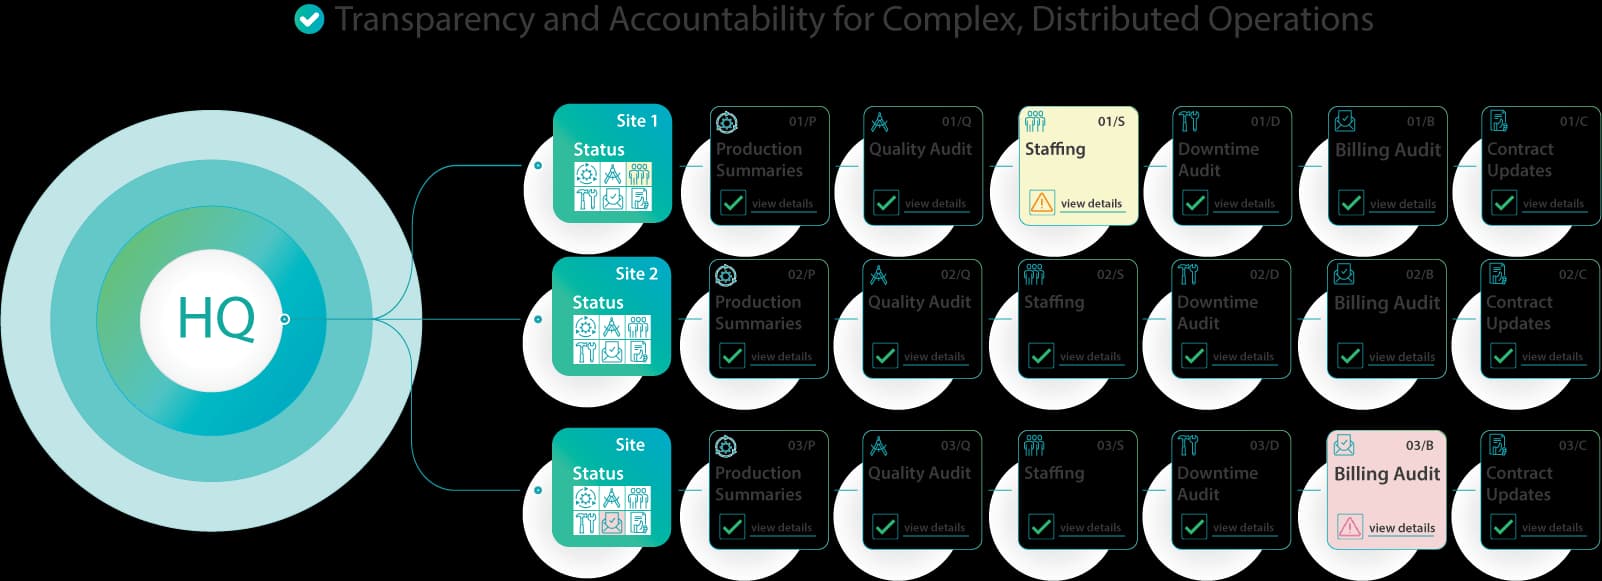
Tailored reporting programs your teams build and maintain themselves — with consolidated views across departments, sites, and service lines.

Healthcare leaders need situational awareness across departments and sites. But most quality data arrives in monthly reports that are already stale, formatted differently by every department, and impossible to drill into.
How it works
- 1
Tailored reporting programs for GoodCatch, well-being, operations, and quality metrics
- 2
Teams define and maintain their own metrics — no analyst bottleneck
- 3
Consolidated views across departments, sites, and service lines
- 4
Process reliability analysis that surfaces systemic patterns in the noise
What makes ImprovementFlow different
Built for healthcare's matrix structures — roll up data across departments, sites, and service lines without forcing a one-size-fits-all taxonomy.
At UNC Health Care: 250+ project-based granular metrics, real-time visibility replacing stale monthly reports.
Read the UNC Health Case StudyReporting program guides
How to build a safety event reporting program
End-to-end guide to building a safety event reporting program: governance, event taxonomy, submission workflows, triage, analysis, and feedback loops.
Designing a staff well-being reporting program
Annual engagement surveys aren't enough. Learn how to build a staff well-being reporting program with pulse-check cadence and operational decision-making.
Building a healthcare quality metrics program
What to measure, who owns metrics, and how to connect them to improvement projects. Avoid metric overload and build a program that drives decisions.
Designing a tiered huddle reporting program
Tier 1/2/3 huddle structure, escalation rules, what goes on each board, and how to sustain huddles beyond the first 90 days.
Connecting patient experience to operational improvement
HCAHPS scores plateau without operational linkage. Learn how to connect patient feedback to safety events and process improvement for real movement.
Building a compliance reporting program for healthcare
Map CMS, Joint Commission, and state requirements to your reporting program. Design compliance infrastructure that satisfies regulators.
Related Solutions
Currently viewing: Quality Reporting
See it in action
Most customers begin with safety reporting or huddle boards and expand from there. No enterprise commitment required.